


Competitive Data, a company specialising in market research and strategic marketing consultancy, has carried out, as it does every year, an analysis of the financial statements of the top 172 DIY retailers. The latest analysis refers to the three-year period 2015-2017.
Revenues are up, while margins are down
The study shows an increase in total revenues, with a growth level of 4.5%, and in this regard the regions of Central Italy are the ones that recorded the best performance (+14.0%), followed by those of the North East (+6.4%), whereas Italy’s southern regions and islands recorded 5.8% growth. Bringing up the rear are the regions of the North West (+3.3%).
Looking at the individual regions, Lazio enjoyed the most sustained growth (+18.2%), whereas Piedmont, at the other end of the spectrum, recorded negative growth (-17.6%).
Meanwhile, the EBITDA figures produced some surprises. Overall, the figure was down (-9.8%), but the study revealed marked differences between different areas; indeed, while the central Italian regions recorded a considerable increase (+28.4%) and the North East a 17.9% growth, the regions in the North West of the country and those in the South and islands recorded shrinking results of -14.9% and -6.9% respectively.
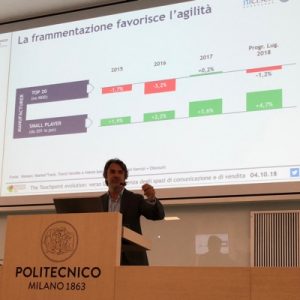
Grouping the companies by turnover, those in the 10-30 million euro bracket recorded the greatest growth (+5.1%), followed by those with turnovers of more than 30 million euros (+4.7%), and then those with turnovers of less than 10 million euros (+1.8%).
…which means a reduction both in profits and in the number of companies recording profits
With regard to profits, the cumulative figure for 2017 was 72,264,000 euros, which represents a considerable drop (-52.0%) compared with the 150,430,000 euros recorded in 2016.
Analysing mean profits by region, Lombardy tops the list with profits of 1,746,000 euros, while Piedmont recorded mean losses of 4,916,000 euros.
Profits expressed as a percentage of sales amounted to 0.9% in 2017, a sharp reduction compared with the 2.0% recorded in 2016, and also down on the 2015 figure of 1.3%.
In 2017 a total of 146 companies closed the year in profit, three fewer than the 149 companies in the same position in 2016.
Poorer profitability indicators
By aggregating the financial statements of companies that together generated over 50% of the revenues in this sector you obtain the overall figure of the sector, from which to calculate the average reference values against which to compare individual companies’ performances.
- The average ROE in 2017 was -0.2%, a considerable drop compared to the +2.3% recorded in 2016.
- The average ROI was 1.6%, down on the 2016 figure of 4.3%.
- The ROS was 0.4%, as opposed to 1.1% in 2016.
The average EBITDA with respect to turnover, or gross operating margin, showed a similar trend, dropping from 3.4% in 2016 to 2.8% in 2017.
The year in question, 2017, saw a worsening of financial risk, with debt ratio, or leverage, starting to increase again, to reach 3.9 as opposed to the value of 3.6 recorded in 2016. Financial charges as a percentage of sales stood at 0.2%, and were unchanged compared with 2016.


Facci sapere cosa ne pensi